- Concept of Network Analysis.
- Objectives of Network Analysis.
- Advantages of Network Analysis.
- Disadvantages of Network Analysis.
- Techniques for Network Analysis.
- Networking Components.
- Precedence Relationship.
- AOA and AON Approaches for Several Commonly Encountered Activity Relationship.
- Drawing Network.
- Rules for Drawing Network Diagram.
- Common Errors and Dummies in Network.
What is Network Analysis ?
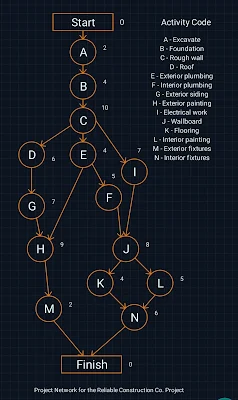
Graphic representation of a project's operations is called a network. It is the combination of activities and events which are require to reach the end objective of a project.
Various activities are performed at the same time and there are various activities which can be started only at the completion of other activities in a big project. The main work for detailed study of the product is to determine the information about the project and then discover a new, better and quicker way to get the work done. Thus thorough study of project is done through some suitable diagram which shows various activities and their positions in the project. It is also helpful to know that in what way the delay in any activity can affect the whole project in terms of time and money. A number of nodes (typically shown as small circles or rectangles) and a number of arcs (shown as arrows) that connect two different nodes exist in a project network (figure).
Network analysis involves a group of techniques which are used for presenting information about the time and resources involved in the project so as to assist in the planning, scheduling and controlling of the project. The information usually represented by a network includes the sequences, interdependencies, interrelationships and critical activity of various activities of the project.
Objectives of Network Analysis :
1) Minimize Production Delay, Interruptions and Conflicts :
This is achieved by identifying all activities involved in the project, their precedence constraints, etc.
2) Minimization of Total Project Cost :
After calculating the total cost of the project the next step is to minimize the total cost. It is done through the calculation of cost of delay in the completion of an activity of the project and calculating the cost of the resources which are required to complete the project in a given time period.
3) Trade-off between Time and Cost of Project :
The duration of same activity can be reduced if additional sources are employed and this is the main idea on which the trade-off between time and cost of project is based. Due to technical reasons, the duration can be reduced in a specific limit. Similarly, there is also a most cost efficient duration called 'normal point' stretching the activity beyond it may lead to a rise in direct cost.
4) Minimization of Total Project Duration :
After checking the actual performance against the plan the project duration can be controlled and minimized. If any major difference is found then apply the necessary reschedule process by updating and revising the uncompleted portion of the project.
5) Minimization of Idle Resources :
If there is any variation in the use of scars resources then it can disturb the entire plan and hence it is required that efforts should be made to avoid any increase in cost due to idle resources.
Advantages of Network Analysis :
- For planning, scheduling and controlling of operations in large and complicated projects network analysis is very important and powerful tool.
- For evaluating the performance level of actual performance in comparison to planned target network analysis is a very useful tool.
- With the use of network analysis technological interdependence of different activities can be determined for proper integration and co-ordination of various operations.
- Network analysis gives the proper co-ordination and communication between various parts of the project.
- Network analysis deals with the time-cost trade-off and provides the optimum schedule of the project.
- This technique is very simple and suitable for the computer users.
Disadvantages of Network Analysis :
- Network construction of complex project is very difficult and time consuming in network analysis.
- Actual time estimation of various activities is a difficult exercise.
- Analysis of the project is a very difficult work because a number of resource constraints exist in the project.
- In many situations time-cost trade off procedure is complicated.
Also Read :
Techniques for Network Analysis :
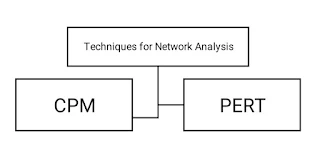
The two common techniques which are used in network analysis are shown in figure below :
The managers are supported by two well-known network analysis techniques, viz, Critical Path Method (CPM) and Program Evaluation and Review Technique (PERT) in planning and controlling of large scale construction projects, research and development, and so on.
These techniques prove to be very important in supporting the managers in handling such products and performing their project management responsibilities.
Networking Components :
1) Events :
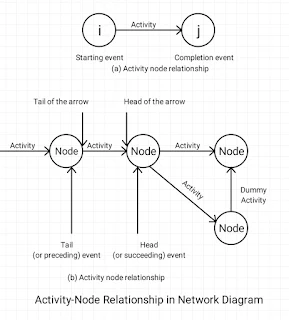
In a network diagram events represent the project milestones. For example, start or completion of an activity or activities, and occurrence of the events at a particular instance of time at which some specific portion of project has been or is to be achieved. In the network events are represented by the circles (nodes). The events can be further classified into the following two categories :
i) Merge Event :
The joint completion of more than one activity which shows an activity is called merge event. This is shown in figure.
ii) Burst Event :
An event which shows the beginning of more than one activity is known as burst event. This is shown in figure.
The numbers are used in a network diagram for representing events. For indicating progress of the work, each event is identified by a number which is higher than its immediate preceding event. The numbering of events in the network diagram must start from left (start of the project) to the right (completion of the project) and top to the bottom. It is noted that there should not be any duplication in the numbering of events.
2) Jobs/Activity/Task :
The project operations (or tasks) are represented by activities which are conducted in a network diagram. These activities take a certain amount of time and require resources for completion. An activity is represented by an arrow and its head indicates the direction of progress in the project. The numbering of starting (tail or initial) event and ending (head or terminal) event identifies activities. For example, an arrow (i, j) between two events shows that the tail event i represents starting of the activity and the head event j represents the completion of the activity which is shown in figure. The activities can be further classified into the following three categories :
i) Predecessor Activity :
Predecessor activity is an activity which is completed before one or more other activities start.
ii) Successor Activity :
Successor activity is an activity which starts immediately after one or more of other activities are completed.
iii) Dummy Activity :
The activity which does not use any time or resource for completion is called dummy activity.
A dummy activity is used in a network to establish the precedence relationship among various activities of the project. It is needed when :
a) Two or more parallel activities in a project have same - the head and tail events.
b) Two or more activities have some (but not all) of their immediate predecessor activities in common.
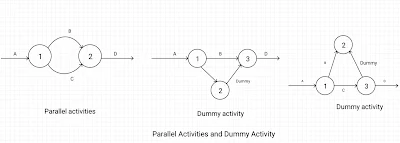
Dummy activity is represented by a dotted line in the network diagram as shown in figure below.
Precedence Relationship :
Diagramatic representation of project as a network needs the establishment of precedence relationships between activities. For undertaking activities, precedence relationship provides a sequence. It states that any activity cannot start until a preceding activity has been completed.
For example :
Brochures announcing a conference for executives must first be designed by the program committee (activity A) before they can be printed (activity B). In other words, activity A must precede activity B. For large projects, this task is essential because incorrect or omitted precedence relationships will result in costly delays. The precedence relationships are represented by a network diagram.
The following two types of precedence networks are used by network models to show precedence requirements of the activities in the project :
1) Activity-on-Arc (AOA) :
In an AOA network, arrow is used for representing the activity and both the ends of the arrow which are called nodes shows the start and end of the activity.
Activities are represented by an arc and events are represented by a node. An activity is separated by a node (an outgoing arc) from each of its immediate predecessors (an incoming arc). One or more activities can be completed at the starting point of any event and one or more events can start from this point. Neither time nor resources are consumed by any event.
AOA approach is an event oriented approach because it focuses on the activity connection points. The precedence relationship explains that an event does not occur until all preceding activities have been completed. AOA approach uses a convention that events are numbered from left to right.
2) Activity-on-Node (AON) :
The second approach in the project network is called Activity-on-Node (AON) in which activities are shown on the nodes and precedence relationship between them is represented by arcs. In other words, activities are represented on the nodes and sequencing connection between two different activities is represented by the arrows. Thus, in AOA diagram of following type :
There is no need of dummy activity because this approach is activity based. An AON diagram is better for visual presentation because it is similar to the bar chart. Thus, visual presentation of a project is done better with the use of an AON network diagram.
AOA and AON Approaches for Several Commonly Encountered Activity Relationship :
Following Figure Shows AOA and AON Approaches for Several Commonly Encountered Activity Relationship.
|
Activity – On – Arc (AOA) |
Activity – On – Node (AON) |
Activity Relationship |
|
|
|
A precedes B, which precedes C. |
|
|
|
A and B must be completed before C can be started. |
|
|
|
B and C cannot begin until A has been completed. |
|
|
|
C and D cannot begin until both A and B have been
completed. |
|
|
|
C cannot begin until both A and B have been
completed, D cannot begin until B has been completed. |
|
|
|
B and C cannot begin until A has been completed,
D cannot begin until both B and C have been completed. |
Drawing Network :
The steps of network construction are as follows :
Step 1 : Properly define the project and it's all important activities or tasks.
Step 2 : Develop the relationships among the activities. Decide which activities must precede the others.
Step 3 : Connect all the activities and draw the network.
Step 4 : Time and/or cost estimates are assigned to each activity.
Step 5 : Calculate the path which has the longest time and this is called critical path.
Step 6 : Use the network for planning, scheduling, monitoring and controlling the project.
Rules for Drawing Network Diagram :
For handling events and activities of a project network there are various concepts and rules which should be followed. It provides help in the development of a correct network structure. Some of them are as mentioned below :
- One and only one arrow is used for representing each defined activity in the network. Hence, any activity cannot be represented more than once in a network.
- All preceding activities must be completed before selecting any new activity.
- The arrow which is used for showing the activity is indicative of the logical precedence only.
- The direction of the arrow indicates the general progression in time.
- When a number of activities terminate at one event, it indicates that no activity emanating from that event may start unless all activities terminating there have been completed.
- Numbers are used for representing the events.
- The activities are identified by the numbers of their starting and the ending events.
- There should be only one initial and one terminal node in a network.
- The joint completion of more than one activity which shows an activity is called merge event, while an event which shows the beginning of more than one activity is known as burst event.
- Parallel activities between two events, without intervening events are prohibited.
- In any network looping is not allowed. Therefore, if A precedes B, and B precedes C, then cannot precede A.
- In the development of a network it must be ensured that loops are not present.
Common Errors and Dummies in Network :
Following are three common errors in a network construction :
1) Looping :
A case of endless loop in a network diagram, which is also known as looping, is shown in figure, where activities A, B and C form a cycle :
Due to precedence relationships, it appears from figure 4.5 that every activity in looping (or cycle) is a predecessor of itself. In this case, it is difficult to number three events associated with activity A, B and C so as to satisfy rule 6 of constructing the network.
2) Dangling :
A case of disconnected activity before the completion of all activities, which is also known as dangling, is shown in figure. In this case, activity C does not give any result as per the rules of the network. The dangling may be avoided by adopting rule 5 of constructing the network.
3) Redundant Activity :
Following are the two cases in which the use of dummy activity may help in drawing the network correctly, as per the various rules :
i) When two or more parallel activities in a project have the same head and tail events, i.e., two events are connected with more than one arrow. In figure, activities B and C have a common predecessor - activity A. At the same time, they have activity D as a common successor. To derive correct network, a dummy activity for the ending event B is required to show that D may not start before B and C, is completed. This is shown in figure :
ii) When two chains of activities have a common event, yet are wholly or partly independent of each other, as shown in figure. A dummy which is used in such a case, to establish proper logical relationships, is also known as Logic Dummy Activity.
In figure, if head event of C and E do not depend on the completion of activities A and B, then the network can be re-drawn, as shown in figure. Otherwise, the pattern of figure must be adhered to.


